
Part of the Infrastructure Master Plan
Water and Salinity, Budget Analysis Project
The Water and Salinity Budget Analysis Project aims to improve understanding of field-scale and system-scale water budgets and to evaluate changes in water quality, with a particular focus on salinity. The goal of this effort is to safely support increased drainage water recycling to: (1) reduce diversions and (2) reduce pumping costs into and out of the Sutter Mutual Water Company service area.
The project was implemented in multiple phases. Phase I began in 2025 and ran until Spring of 2026. Phase II builds on the technical findings and insights gained during the initial phase.
Why do the Project?
Sustainable Groundwater Management Act readiness
2040 contract renewal preparation
Increased awareness of salinity patterns across fields
Improved understanding of SMWC recharge capabilities
Safely support increased drainage water recycling to:
Reduce diversions
Reduce pumping costs into and out of SMWC
Phase 1 Monitoring Summary
Water Budget
Field-scale: Davids Engineering (DE) partnered with participating SMWC growers to monitor water inflows and outflows on 11 agricultural fields (nine rice, one corn, and one tomato) and developed 2025 field-scale estimates of net deep percolation to assess each field’s recharge potential (Figure 1).
System-scale: DE identified data collection improvements necessary to develop a water budget for the entire SMWC service area.
Salinity
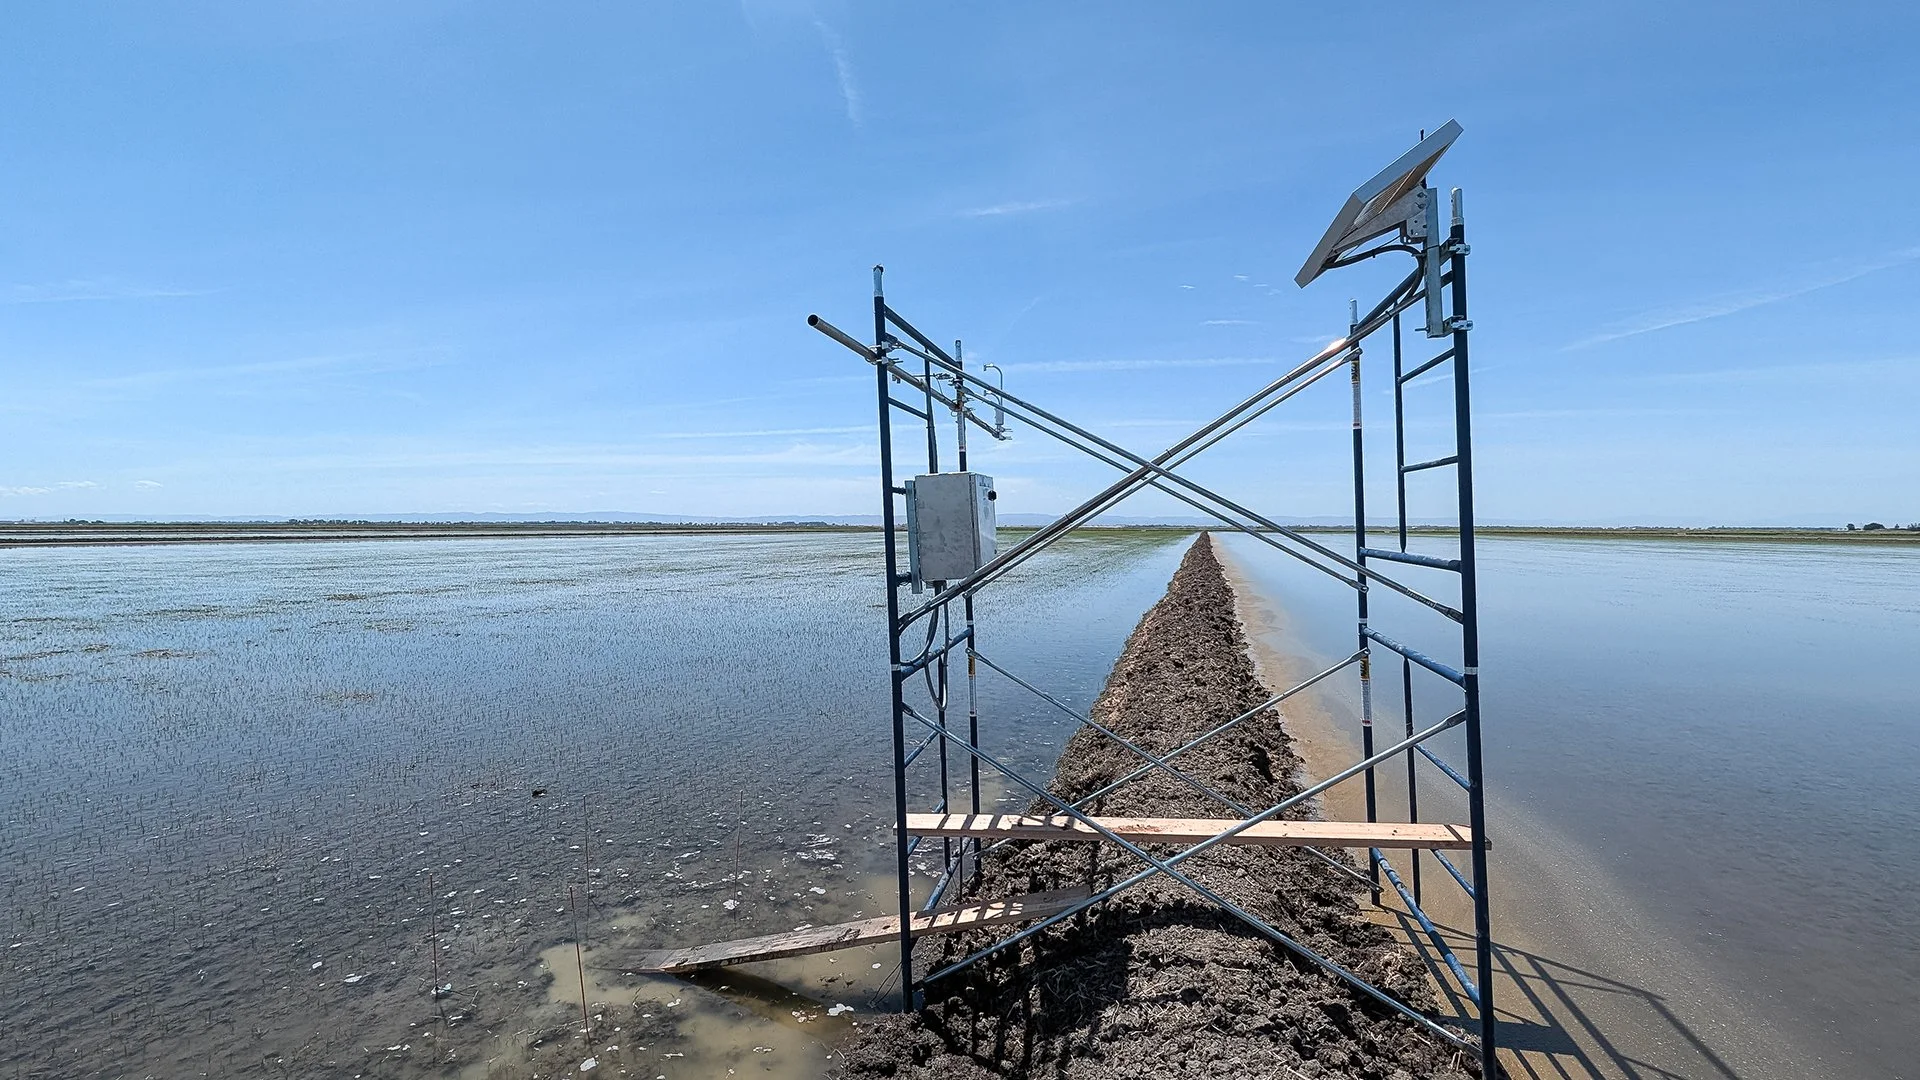
Field-scale: DE monitored electrical conductivity (EC), a proxy for salinity, using periodic and real-time sensors across SMWC canals, laterals, drains, and fields, tracking changes from rice field inlets to outlets to assess whether rice outflows were a primary source of increased salinity (Figure 2).
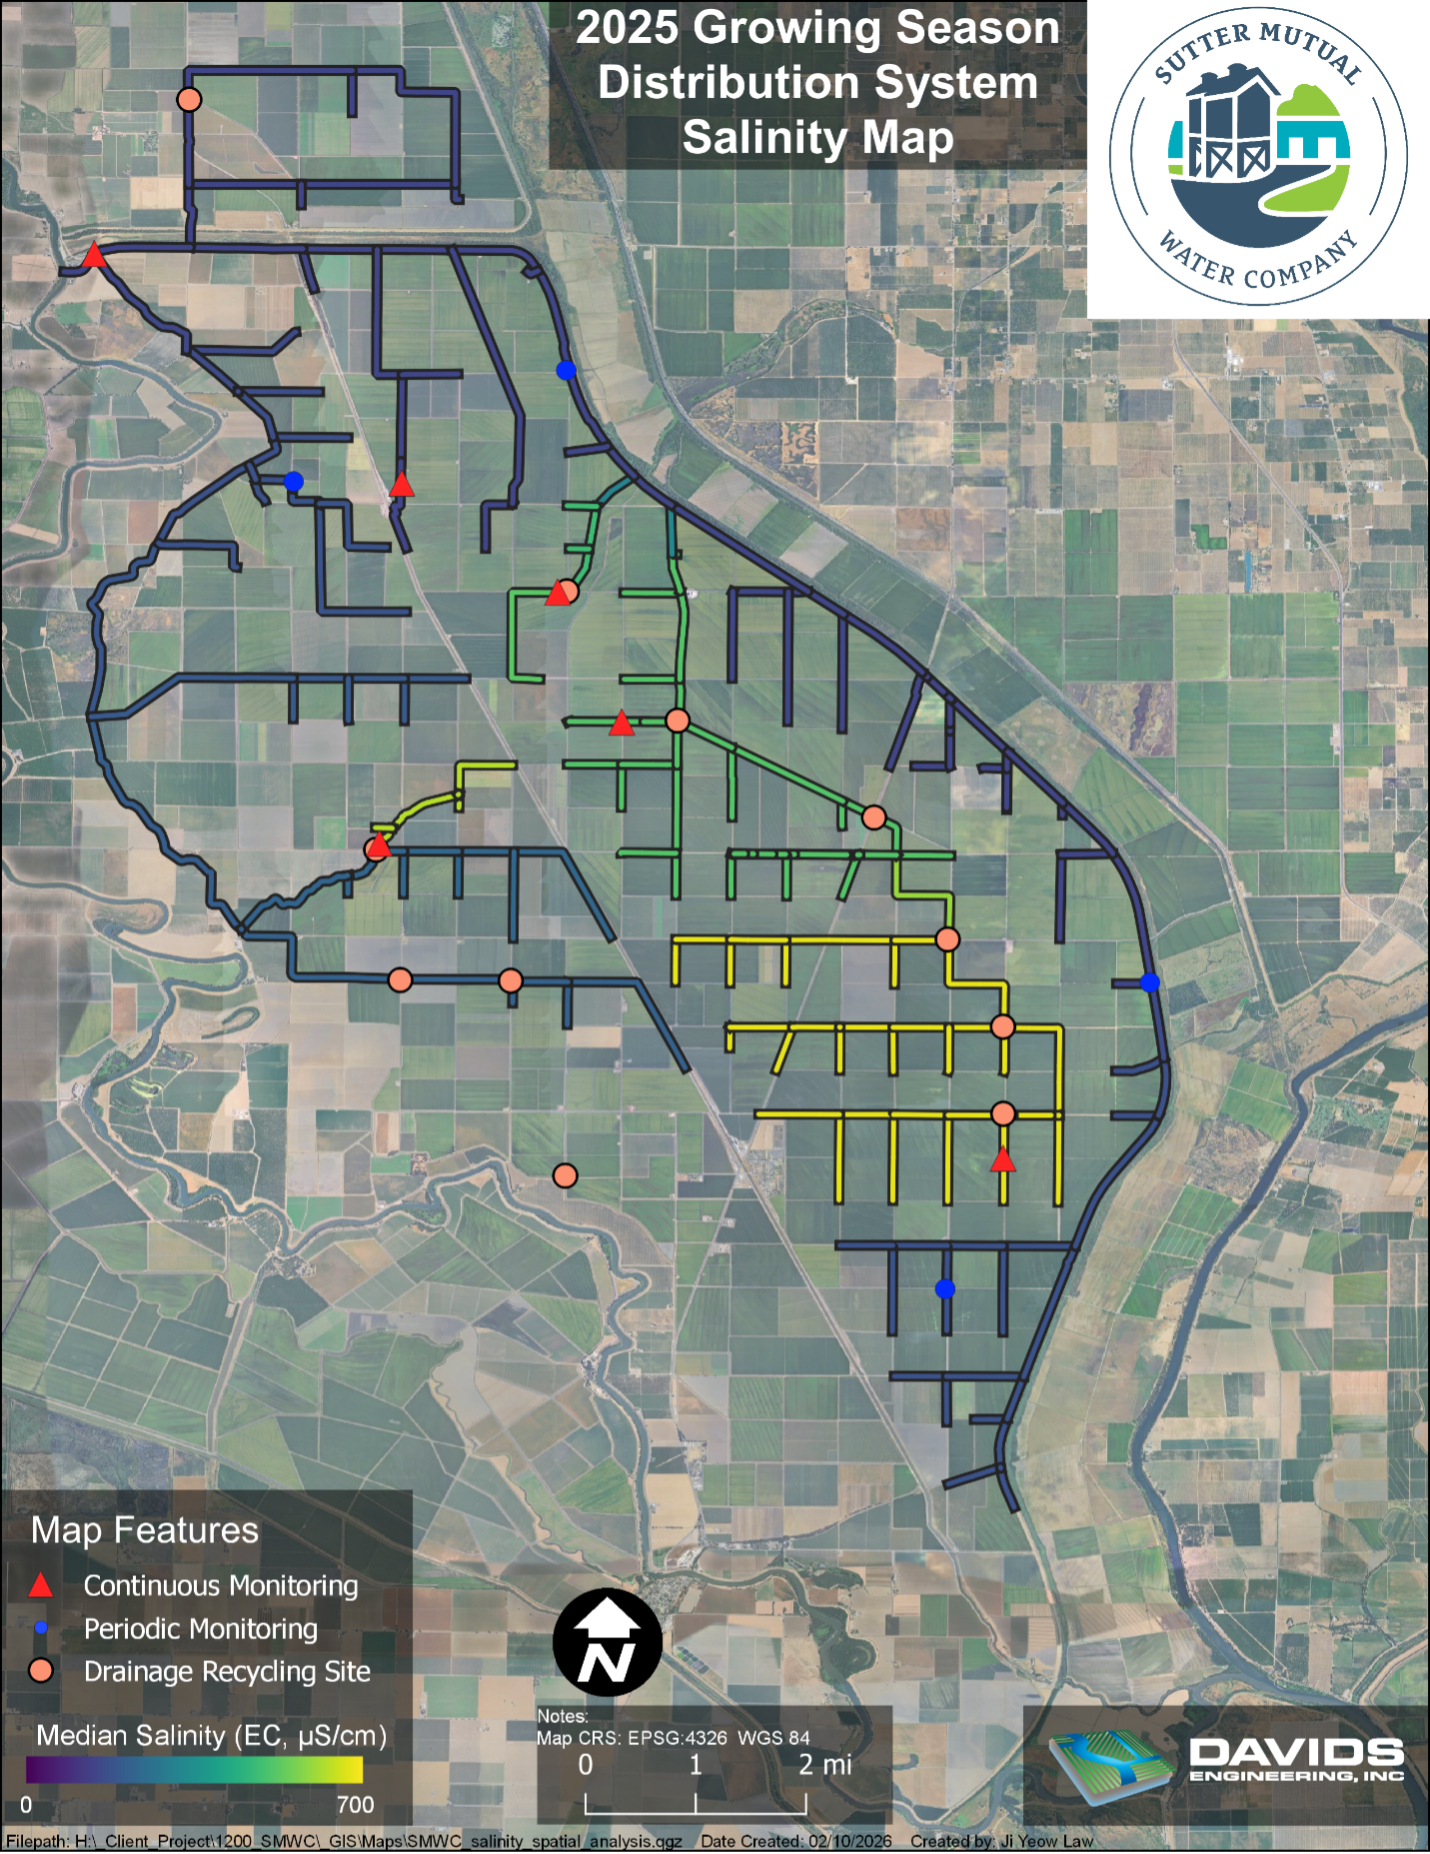
System-scale: In addition to providing real-time salinity data, biweekly reports were delivered to SMWC leadership highlighting EC trends, along with maps identifying high-EC areas in the distribution and drainage system (Figure 3); preliminary findings also informed discussions on potential drain water recycling sites.
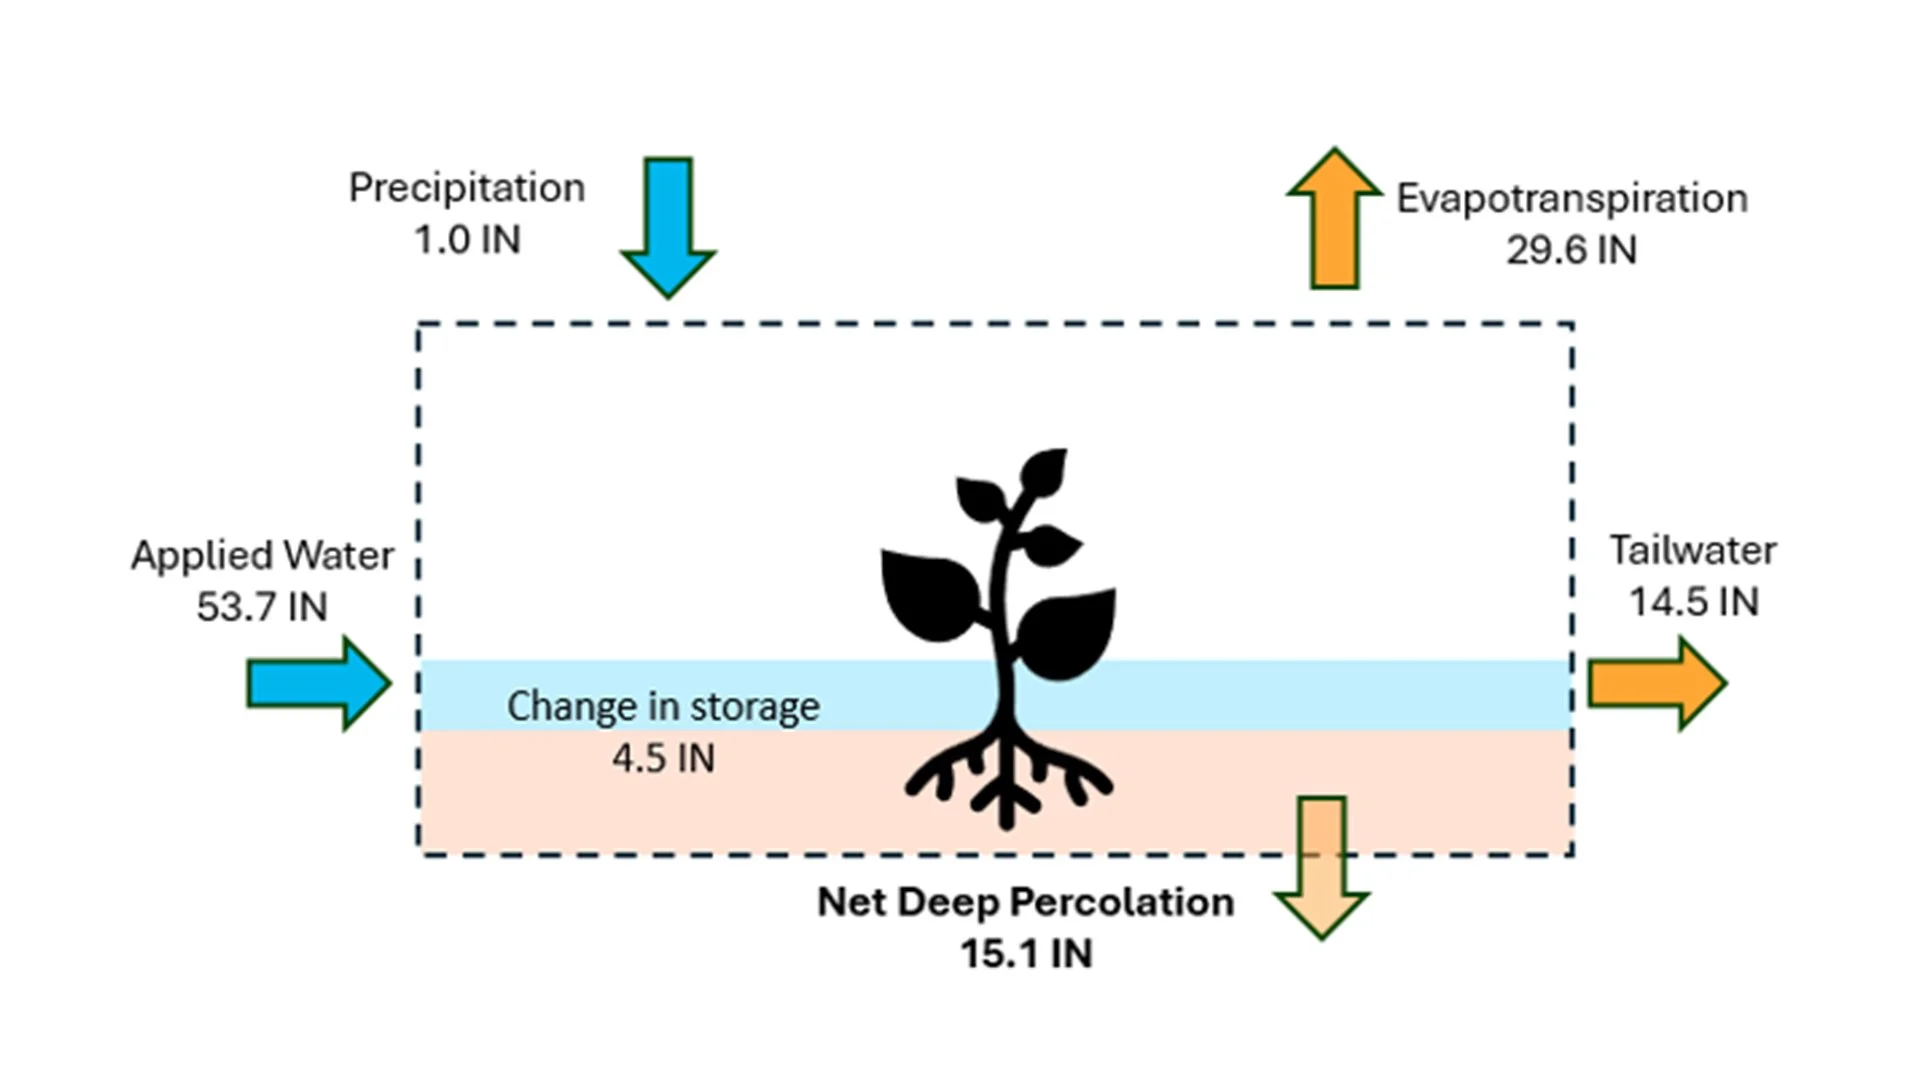
Figure 1. Field scale water budget diagram representing all inflows (applied water and precipitation), outflows (evapotranspiration, tailwater, and net deep percolation), and changes in water storage in rice fields (IN = inches). The weighted average flow path depth values from June to October 2025 from participating rice fields are included. Over the monitoring period, 28% of applied water contributed to net deep percolation, which potentially leads to groundwater recharge
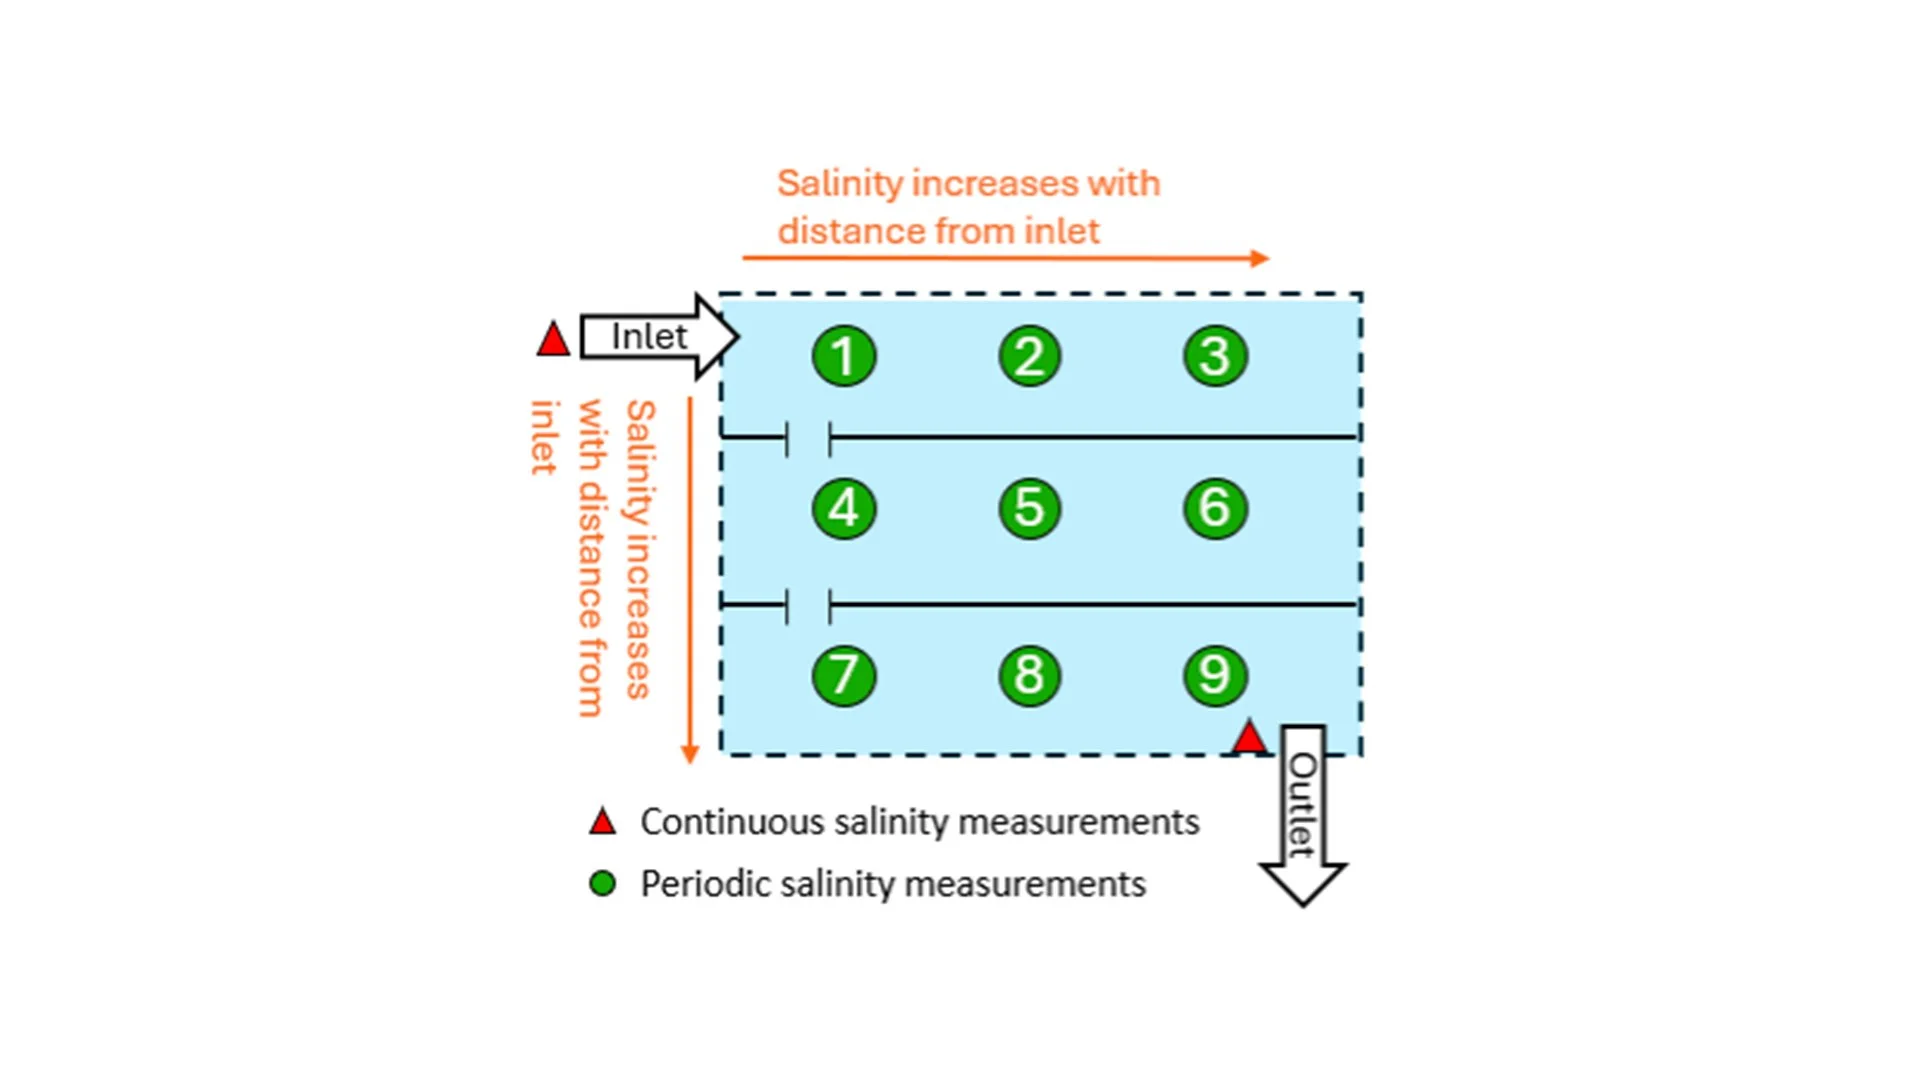
Figure 2. Conceptual and simplified illustration of salinity monitoring locations in a participating rice field.
Phase 2 Monitoring Plan
Phase 2 will expand field-scale water budget and salinity monitoring to additional agricultural fields and work with growers to better quantify tailwater on non-rice crops. At the system scale, priorities include improving outflow estimates at the Karnak Pumping Plant, refining measurements of external drain water entering SMWC, and developing a comprehensive system-wide water budget for the 2026 growing season and beyond. Salinity management will also include expanding the sensor network, producing daily EC maps to support operational decisions, and continuing to evaluate opportunities for additional drainage water recycling sites.
Figure 3. 2025 Growing Season Distribution System Salinity Map